
Abstract
Users of websites tend to ignore text advertisements, especially when they are on the right side of a web page, even when the advertisements are useful for completing a task. This study explores the impact of web page layout conventions on text advertising blindness and how quickly users adapt to websites that violate layout conventions. Participants performed search tasks on either “standard” or “nonstandard” website layouts. In the nonstandard website, content from the left (i.e., navigation menu) and the right side of the website (i.e., text advertisements) were reversed. Results demonstrated that text advertising blindness was prevalent regardless of the website layout. Users adapted to the reversed layout rapidly, but at a cost of perceived mental effort and task success. Analyses of eye movement data showed that users had a tendency to fixate first in the standard location for the navigation menu when using the nonstandard website, but did not fixate more often in that location after the first few trials. A decrease in text ad blindness over time for the standard, but not the nonstandard, website design also was observed. Practitioners are advised not to violate web layout norms in an attempt to draw more attention to web advertisements. This strategy may be counterproductive where it may actually increase text advertising blindness and decrease the usability of the website.
Tips for Usability Practitioners
Practitioners can use the following suggestions that are based on the findings of this study:
- Follow website conventions. Text advertising blindness decreased over time for standard website layouts, but not for nonstandard website layouts.
- Collect subjective measures in conjunction with eye-tracking measures to examine the impact of design on user performance and experience. Measures, such as the SUS, the SMEQ, task difficulty, etc., allow practitioners to understand whether increases or decreases in eye-tracking measures represent changes in satisfaction, mental workload, frustration, etc.
- Have users perform tasks that vary the users’ motivation when examining eye movements on web pages. We used both exact and semantic tasks, which differed in how direct the search targets were described to end users. Having a range is more representative of the variety of searches that users commonly perform.
Introduction
When users browse a web page, they have expectations about where certain types of information will be located. In particular, they demonstrate the phenomenon of “banner blindness” in which they do not look at advertisements when searching a page (Benway, 1998), particularly if the advertisements are above or to the right of the content (Cooke, 2008; Owens, Chaparro, & Palmer, 2011). Here we explore the development and specificity of users’ expectations about content locations, particularly with regard to web advertisements. Do people ignore web advertisements because they look like advertisements or because they are located where advertisements usually appear? We address this question in the current experiment, but first we review literature about users’ expectations of web page layouts and how quickly they adapt to newly encountered layouts over time.
Owens et al. (2011) demonstrated that users experience text advertising “blindness” when searching for information on web pages in that they tend to ignore areas of a page that are usually dedicated to text ads (i.e., top and right side of the page). It was also found that users especially associate the right side of a web page with text ads and view this area of the page last, if at all.
Various conventions have been established for web page design. In a series of studies that used similar methodologies in which participants placed squares representing types of web objects on grid paper, researchers found that users have expectations for where web elements should be located (Bernard, 2001; Bernard, 2002; Bernard & Sheshadri, 2004; Shaikh, Chaparro, & Joshi, 2006; Shaikh & Lenz, 2006). In the Bernard (2001) study, both novice and experienced web users expected internal links (e.g., site navigation) to exist on the left side of a web page. Likewise, both types of users considered the left and right sides of the page as likely locations for external links, though this association was not as strong as with internal links. While both novice and experienced users thought advertisements existed at the top of the page, novice users were more diffuse in their expectations about ad locations.
Shaikh and Lenz (2006) noted that some conventions changed since Bernard (2001) examined website design conventions. They found that participants were as likely to expect advertisements to be located on the right side of the page as the top of the page. They also found that participants expected internal links (navigation) to be on the left of the page as well as the top of the web page.
Similar web usage conventions also exist cross-culturally (Bernard & Sheshadri, 2004; Shaikh, Chaparro, & Joshi, 2006). For instance, participants from North America, Europe, India, Australia, the United Kingdom, New Zealand, South Africa, and Hong Kong expected internal links (navigation) on the left side of the page, while advertisements were expected to be at the top of the page and, in some cases, the right side of the page (Bernard & Sheshadri, 2004). The researchers noted that 76% of participants stated that their expectations also matched their preference for the location of the web objects. Thus, across a wide sampling of cultures, participants expect navigation regions to be on the left and advertising regions to be on the top and right side of web pages.
It appears that these conventions are well-established. In a brief survey of the top 25 websites (by traffic) in the United States, based on information from Alexa (2012), 84% of websites contained navigation on the top of the page, 48% of websites contained navigation on the left side of the page, and only 8% contained navigation on the right side of the page.
Similar to studies that used paper-based methods to elicit web page layout schemas, Di Nocera, Capponi, and Ferlazzo (2004) instructed participants to click on a blank screen to indicate where they expected certain web objects to be located. The authors found that users clustered certain links together in particular regions of a web page and also that what was clustered and where it was located differed by experience. For instance, both experts and novices had similar expectations for the location of a home link, but differed for other links like “help” or “resources.” While the methodologies differed slightly between the studies (usage of paper vs. clicking on a computer screen), the results consistently demonstrate that users have expectations about where web elements and links should be located.
Adaptation to Nonstandard Layouts
Previous research has examined user behavior when design conventions are violated. McCarthy, Sasse, and Riegelsberger (2003) found that individuals, while initially affected by a violation in convention, quickly adapted to the design with the violations. In this particular study, the researchers placed navigation either in the left, top, or right side of the web page. They also manipulated the complexity of the web page by adjusting how many content and advertising regions were present. On the initial view of the page, participants were fastest to complete the task involving navigation on the left side of the page and slowest to complete the task using navigation on the right side. After the first trial, no performance penalties in task completion time were observed, regardless of navigation position. Eye tracking data revealed that participants adjusted their strategy to reflect the new menu position.
In a study examining the adaptability of users, researchers asked participants to locate the “About Us” link on 10 different web pages (Tzanidou, Petre, Minocha, & Grayson, 2005). Participants saw repeated exposures of nonstandard designs where the “About Us” link was in a location considered to violate design conventions. Time-to-first fixation for nonstandard link locations decreased over seven exposures, with times being even faster for repeated exposures of previous nonstandard “About Us” link locations. Re-exposure to a nonstandard design increased time-to-first fixation slightly, but was notably faster than the first trial. Participants were also asked where they expected “About Us” links to be located. Prior to the experiment, participants reported those links should be located on the top of the page, while afterward they reported the links should be on the bottom of the page.
While the overall results of this study suggest that users can adapt to violations of design standards, the researchers did not measure initial time-to-first fixation when the “About Us” link was located in a standard location. Without an initial measurement, it is unknown if time-to-first fixation for the top location changed due to exposures to the nonstandard web pages. Additionally, the initial fixation entry point on the website was not balanced or controlled. Half of the participants modified their scan patterns to begin in the lower portion of the page. This lack of experimental control may explain why time-to-first fixation was faster for the standard web page designs.
A separate study examining convention violations for web pages found that such violations disrupted participant performance, but also that the participants quickly adapted to the nonstandard site design (Santa-Maria & Dyson, 2008). Corrective behavior, such as back tracking or revisiting previous pages to look for information, was more frequent for the nonstandard site. However, this behavior decreased or was absent in later testing. Also, as the number of tasks performed on the site increased, the number of correct responses to the tasks also increased for tasks completed on the nonstandard site.
Purpose
The purpose of this study was to explore the cause of text advertising blindness by examining user search performance on standard and nonstandard website layouts. Text advertising remains one of the primary advertising formats on the Internet (Interactive Advertising Bureau, 2012). For 2011, search advertising, which is commonly displayed as text advertising, accounted for 47% of all advertising revenue. If text advertising blindness is based entirely on the location of the ads, then we expected that there would be less blindness for nonstandard layouts. However, if text advertising blindness is due to the appearance of the ads, then we expected to observe similar levels of blindness in both layouts. Finally, if it is due to some combination of both possibilities, then we expected that the level of advertising blindness observed would change over time as users adapted to the nonstandard layout.
Methods
The following sections discuss the participants, materials, stimuli, tasks, questionnaires, and procedures used in this study.
Participants
Fifty-four participants, 18 years of age and older, (14 males, 40 female, M age = 22.1 years; SD = 5.91) were recruited from Wichita State University. All participants were undergraduate students enrolled in psychology courses. All participants reported normal or corrected-to-normal vision and were native English speakers. Participants were compensated for their time with course credit. Seventy-four percent reported using the Internet more than 7 hours per week, mostly for email, education, and social networking, followed by browsing, entertainment, gathering information, reading news, and shopping.
Materials
A Tobii X120 eye tracker was used to record participants’ eye movements. For the purposes of this study, eye movement data were recorded at 60Hz. The eye tracker had an accuracy of 0.5 degrees and was used in conjunction with a Dell 19-inch LCD screen at a resolution of 1280 by 1024 pixels with 24-bit color. The size of the active screen was 37.7 by 30.0 cm (width by height). At an average viewing distance of 57.1 cm, the stimulus, within the web browser window, subtended 36.53 degrees horizontally and 29.44 degrees vertically. Data were collected using a Dell Precision workstation with a quadcore 3.0 GHz Intel Xeon processor, 12GB of RAM, and a 2GB nVidia Quattro Pro graphics card. The system used Microsoft Windows 7 and all web page stimuli and questionnaires were displayed to participants using the web browser Microsoft Internet Explorer 9. Other than the Tobii Studio component, all other add-ons for Internet Explorer 9 were disabled. Eye movements were recorded with Tobii Studio 3.0.1.196. Tobii Studio was used for the visualization, analysis, and review of collected eye tracking data. SurveyMonkey.com, a web-based survey tool, was used to collect pre- and post-experiment questionnaires, satisfaction, and mental workload from participants. Custom web-based software was used to display tasks to participants in a web browser and record the task difficulty for each task. The software also allowed the facilitator to record task success.
Stimuli
The stimuli, adapted from Owens et al. (2011), consisted of two versions of a website that contained 29 pages of information about traveling to Hawaii. The website minimized design differences across pages and topics. The Hawaii Convention and Visitors Bureau and Wikipedia were used as sources of content for the website. The website contained seven primary areas. The areas included a general information section about all the Hawaiian Islands and one section for each of the major islands. The islands included the Big Island of Hawaii, Kauai, Lanai, Maui, Molokai, and Oahu. Each main section was divided into sub-sections, which detailed information about the history, places of interest, travel tips, or major attractions on each respective island. Each page of the website had a similar layout. Each page contained top navigation, side navigation with contact information, content, a top-advertising region, a side-advertising region, a logo, and a footer. Both advertising regions contained text advertisements that had a title, short description, and a link. This link did not allow participants to leave the website, but provided the appearance of a working text advertisement. The top advertising region contained two text advertisements, while the side advertising region contained five text advertisements. Both areas contained the words “Sponsored Links” at the bottom of each region.
Both versions of the website were identical except that in the nonstandard version, the side navigation menu with contact information was flipped from the left side to the right side of the page. Conversely, the text advertisement content was moved from the right to the left side of the page. In Figure 1, four areas of interest (AOIs) are indicated: Region A is side navigation, region B contains the top advertisements, region C contains the top two paragraphs of the content, and region D contains the side advertisements.
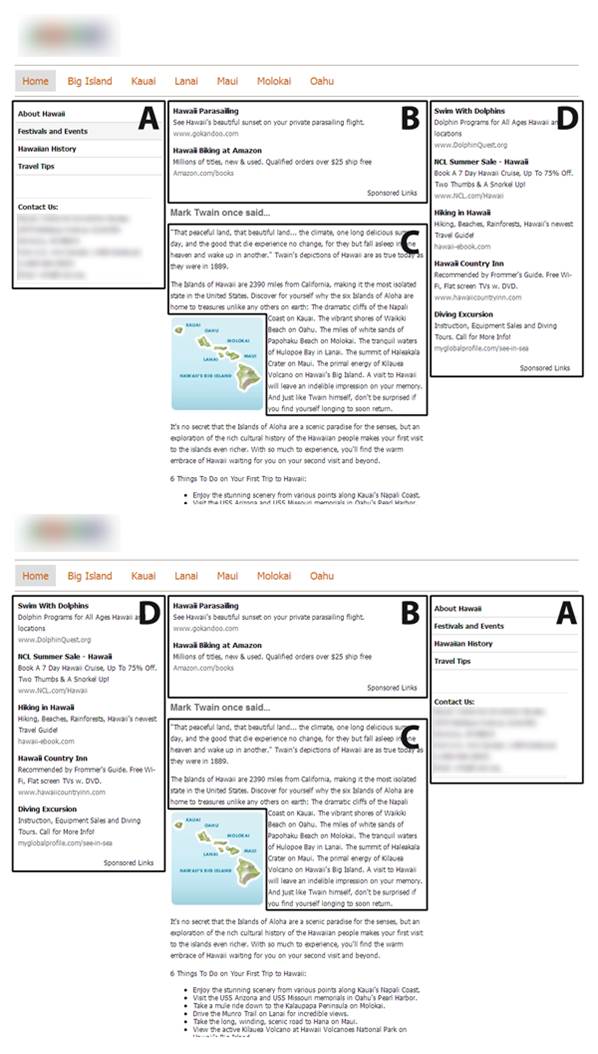
Figure 1. The home pages of both layouts of the website stimulus. The top version is the standard layout, where advertisements are located on the right side of the page. The bottom version is the nonstandard layout, where advertisements are located on the left side of the page. A: Side Navigation, B: Top Advertisements, C: Content, D: Side Advertisements.
Tasks
Participants completed 20 tasks on the website stimulus described above (2 practice, 18 experimental trials). Tasks varied in type and location of search target. The location of the search target was either in the content of the website (n=8), in one of two advertising regions (n=8), or absent from the website (n=2). In the advertising areas, tasks were distributed evenly between the top- and the side-advertising region (n=4 each). Absent tasks prompted participants to search for targets that did not exist on the website.
Participants completed searches that were either exact or semantic in nature. During an exact search, participants were asked to search for the exact text identified in the task. Exact search tasks always included a four-digit number in the text to help facilitate rapid visual search. During a semantic search, participants were asked to find information that required the participant to use a more thorough search of the website for the target. The following are examples of the types of search tasks:
- Exact search: You are writing an article on the history of the Hawaiian Islands. You need to confirm that the first habitants of Hawaii travelled over 2,050 miles in canoes.
- Semantic search: Find information about the type of military branch that is at the National Landmark on Oahu, which is dedicated to the attack that led the U.S. into WWII.
All tasks provided information to facilitate the selection of the correct path on the website. Additionally, all targets were located above the page fold, or the location of the page that did not require scrolling to access. Participants first completed two practice trials to familiarize themselves with the task types and procedure. The targets for the practice tasks were in the content of the website and located on the home page or a secondary page to help familiarize participants with the navigation of the website and to prompt them to search outside of the website home page.
Task order was counterbalanced across target location and participants to control for any potential order effects. The order of tasks alternated between advertising and content target locations. For example, if the participant received a top advertisement search target, the next task would target content, and the following a side-advertising region (no participants reported being aware of this task structure). The order of semantic and exact search types was randomized across location targets and analyses were collapsed across search type.
Questionnaires
Four questionnaires were used in this study: a pre-experiment questionnaire, the Subjective Mental Effort Questionnaire (SMEQ), the System Usability Scale (SUS), and a post-experiment questionnaire. The pre-experiment questionnaire was used to gather participant demographic information such as age, gender, and time spent using a computer and the Internet. Additionally, the questionnaire asked general questions about travel and how frequently they visit the Hawaiian Islands. In the post-experiment questionnaire, participants were asked questions regarding the website and to sketch a prototypical web page from the website and provide labeling for major elements in the sketch. After each task, participants were asked to rate its difficulty on a 5-point Likert scale.
The SMEQ is a one-item instrument that measures the mental effort expended to complete a task (Sauro & Dumas, 2009). In this study, the SMEQ was used to measure the overall mental effort associated with using the website. The item used a 0-150 point scale with nine anchors, which ranged from “no effort at all” to “exceptional amount of effort.” The SUS is a 10-item instrument used to measure the usability of a system (Brooke, 1996). It was modified by replacing the word system with website to clarify the confusion between system and the stimulus used in the study.
The task difficulty question prompted participants to indicate how difficult each task was to complete. The single item was on a 5-point Likert Scale where 1 indicated “Very Easy” and 5 indicated “Very Difficult.”
Procedure
When participants arrived, they were seated in front of the eye tracker (on average, participants were 57.1 cm from the monitor). Participants were given a consent form to review. If they agreed, they provided consent by signature and then completed the pre-experiment questionnaire.
After completing the pre-experiment questionnaire, the facilitator read instructions to the participant. First, the facilitator explained the purpose of the study, which was to examine the usability of a travel website, then provided information about the eye tracking aspect of the study. Participants were instructed that they would be given various task instructions and be asked to complete the tasks using the provided website. They were told to work through the tasks as if they were working by themselves, but if they needed to have the task information again, the facilitator would provide that information.
Prior to the first task, participants were assigned to one of the two website conditions (i.e., standard or nonstandard layout), which they used to complete all the tasks. After their assignment, participants were calibrated on the eye tracker using a 9-point automatic calibration routine provided in Tobii Studio. Participants that were unable to accurately calibrate were excluded from the study. Accurate calibration was defined as a participant’s gaze overlapping with the calibration dots displayed during the Tobii Studio Check Calibration routine. Calibration was considered accurate when the participant’s gaze deviated less than 1 degree from the calibration dot locations.
Once calibrated, participants were asked to read their first task aloud, close the task window, and view the travel website. Participants were asked to click on the task target when located and close the browser window. If the task was not completed in the allotted time (105 seconds), the browser window closed automatically. After the website browser window closed, participants rated the task difficulty on the 5-point Likert Scale. Once this process was finished, they completed the same procedure for the remainder of the tasks.
After the completion of all tasks, participants completed the SMEQ, the modified SUS, and the post-experiment questionnaire.
Results
The following sections discuss task success, ad location recall, task difficulty, and eye tracking metrics for the standard and nonstandard layout conditions.
Task Success
Task success was examined by layout (standard or nonstandard) across target location (content region, top ad region, side ad region). Overall, participants were more successful using the standard website (M = 67%, SD = 21.8%) than the nonstandard website (M = 53.5%, SD = 21.8%), F(1, 51) = 5.17, p = .03, η2 = .09. For both the standard and nonstandard layouts, participants experienced the highest success while locating targets in the content region of the website (M = 88%, SD = 11%), followed by the top ad region (M = 55.6%, SD =34.6%), and the side ad region (M = 37%, SD =33.9%), Wilks’ Λ = .28, F(2, 51) = 73.70, p < .01, multivariate η2 = .74, replicating previous studies of advertising blindness (e.g., Owens et al., 2011). See Figure 2 for success across target location and layout.
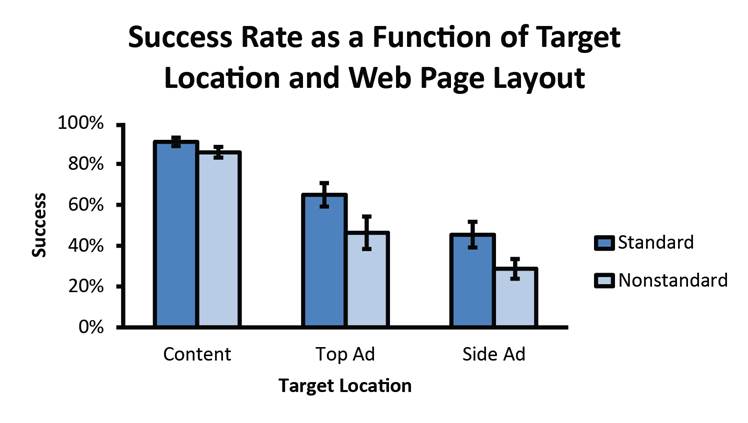
Figure 2. Percent success by target location and layout. Error bars are ± 1 standard error of the mean.
Analyses by Trial: Cumulative Success
Participants’ success was examined over the duration of their trials per target location. By examining success, it was possible to determine overall trends for how participants adapted to the standard and nonstandard websites. Three separate analyses were conducted for the three regions of interest in the web page:
- A 2 (layout) x 8 (trial) mixed ANOVA was conducted to examine participants’ success over the duration of the testing session to determine the effects of layout while locating targets in the content region of the website. The results indicated no significant main effects for trial number or interaction, p > .05.
- A 2 (layout) x 4 (trial) mixed ANOVA was conducted to examine participants’ success over the duration of the testing session to determine the effects of layout while locating targets in the top ad region of the website. The results indicated no significant main effects for trial number, layout, or interactions between the layout and trial number, p > .05.
- A 2 (layout) x 4 (trial) mixed ANOVA was conducted to examine participants’ success over the duration of the testing session to determine the effects of layout while locating targets in the side ad region of the website. The results indicated a significant interaction between layout and trial number, Wilks’ Λ = .80, F(3, 50) = 4.06, p = .01, multivariate η2 = .20. See Figure 3 for success by trial for layout during side ad target searches.
Pairwise planned comparisons were conducted to determine the effects of layout. While participants exhibited the most blindness for the side advertising regions in both the standard and nonstandard layouts, differences in performance were noted over time. As the experiment went on, participants became less prone to text advertising blindness for side ads in the standard layout condition, but not in the nonstandard layout condition. Participant success gradually increased when searching for targets located within the side ad region of the standard website with success being significantly greater on the last trial than the first two trials. However, during searches on the nonstandard website, participant success stayed about the same. These results suggest that participants experienced a learning effect that the side advertisements were useful to the completion of their tasks while using the standard layout. However, the degree of advertising blindness remained consistent across the side ad trials while using the nonstandard layout.
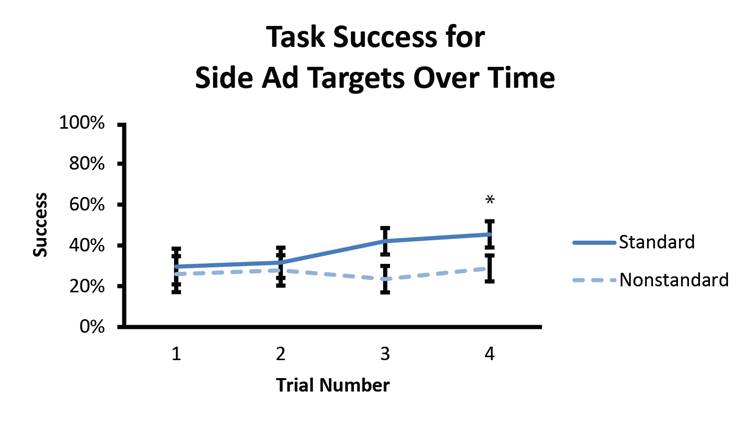
Figure 3. Success by trial during side ad target searches. Error bars are ± 1 standard error of the mean. * indicates significance less than p < .05.
Difficulty Rating
Task difficulty was examined by layout (standard or nonstandard) across target location (content region, top ad region, side ad region). Figure 4 demonstrates the mean difficulty rating on successful trials as a function of target location and layout.
Overall, participants rated tasks completed on standard websites (M = 2.36, SD = .42) as equally difficult to nonstandard websites (M = 2.62, SD = .41), p > .05. For both layouts, participants experienced the least difficulty while locating targets in the content region of the website (M = 1.91, SD = .46), followed by the top ad region (M = 2.56, SD = .68), and then the side ad region (M = 2.91, SD = .70), Wilks’ Λ = .31, F(2, 30) = 33.15, p < .001, multivariate η2 = .69.
While there was no significant interaction, a trend was noted where tasks in the side ad condition were perceived to be more difficult in the nonstandard versus standard layout, F(1, 31) = 2.99, p = .09, η2 = .09. Participants rated the side ad target tasks as more difficult when using the nonstandard version of the website as opposed to the standard version.
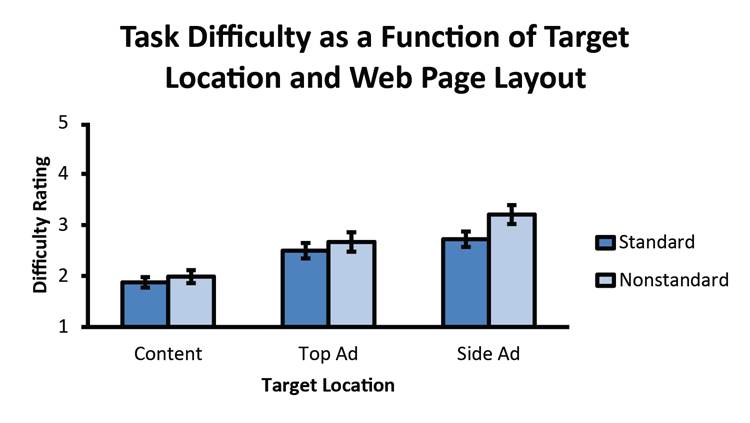
Figure 4. Task difficulty for successful tasks by target location and layout. Error bars are ± 1 standard error of the mean. A rating of 5 = most difficult.
Task difficulty was examined over time to determine whether any trends differed between the standard and nonstandard layouts as the experiment progressed. Linear regressions were conducted on task difficulty ratings for side ad target trials in each layout condition.
No significant differences were noted in the overall trends between the difficulty of tasks successfully completed, p > .05. However, the difficulty of the final trial on the nonstandard layout was significantly higher than that of the standard layout, t(25) = 3.08, p < .01. This demonstrates that there was a perceived increase in difficulty for tasks using the nonstandard layout and a perceived decrease in task difficulty for tasks using the standard layouts over time. See Figure 5 for task difficulty of side ad target searches.
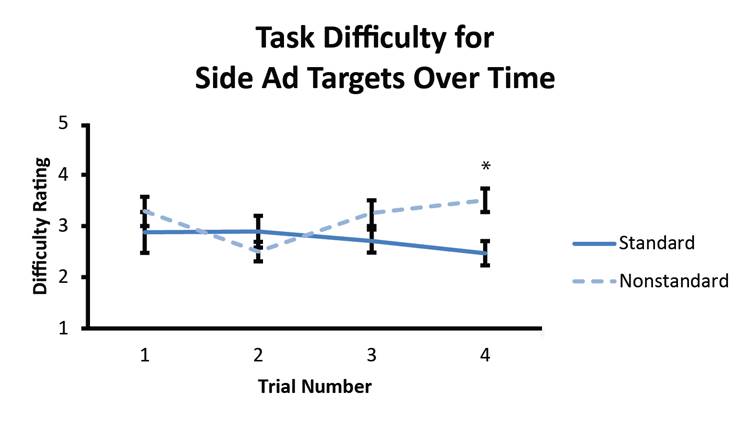
Figure 5. Task difficulty ratings for successful tasks on side ads target trials. Error bars are ± 1 standard error of the mean. * indicates significance, p < .05. A rating of 5 = most difficult.
Satisfaction and Workload
Satisfaction scores (SUS) using the standard website (M = 60.65, SD = 20.08) and the nonstandard website (M = 56.67, SD = 18.72) were not significantly different, p > .05. Both scores were in the “OK” range (Bangor, Kortum, & Miller, 2009), which most likely reflected the participants’ inability to complete some tasks and the overall blandness of the website. It is suspected that the lack of significance is related to the between-subjects design, where participants were unable to make comparisons between the standard and nonstandard layouts.
Analysis of perceived workload (SMEQ) indicated that participants reported expending more mental effort while using the nonstandard website (M = 74.48, SD = 26.97) than the standard websites (M = 61.44, SD = 19.94). An independent t-test was conducted to compare SMEQ scores by layout, t(52) = 2.02, p < .05, Cohen’s d = .56. This result indicated that violating conventions in the nonstandard layout resulted in higher mental effort. See Figure 6 for a comparison of mental effort between layout conditions.
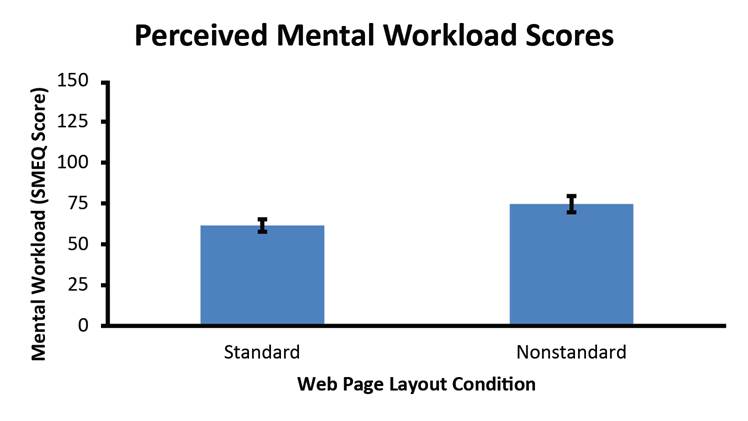
Figure 6. Mental effort scores by layout. Error bars are ± 1 standard error of the mean. The higher the bar, the higher the perceived mental workload.
Eye Tracking Analyses
Analyses of eye movements on the home page for the website (the first page viewed on each task) offered insight into how participants began their search of the site on each trial. The frequency of whether or not a participant fixated on each area of interest (AOI) on the home page of each trial was calculated for both layout conditions. Chi-square tests of association were conducted for each of the AOIs (content, side navigation, top ads, and side ads) across both layout conditions. Additionally, ANOVAs were conducted to examine dwell time and average fixation duration. The top ads AOI was fixated more often than expected from chance by participants using the nonstandard website than the standard website, Χ2 = (1, N = 963) = 19.19, p < .01. Similarly, the side ads AOI was fixated more often than expected from chance by participants using the nonstandard website than the standard website, Χ2 = (1, N = 963) = 24.25, p < .001. Across the standard/nonstandard conditions, neither total dwell time nor average fixation duration differed, p > .05. See Figure 7 for percentage of AOIs fixated during the first page view in standard and nonstandard layouts.
Considering the side ads were located where side navigation typically is for users in the nonstandard layout condition, these results indicate that participants had expectations about the location of elements on the web page. Their tendency to view the left region of the page significantly more often than the right region of the page at the beginning of the trial demonstrates that this may be an automated behavior that was in accord with their overall search strategy. The differences noted in the top ad region were likely the result of changes in scan patterns between both top and side navigation regions.
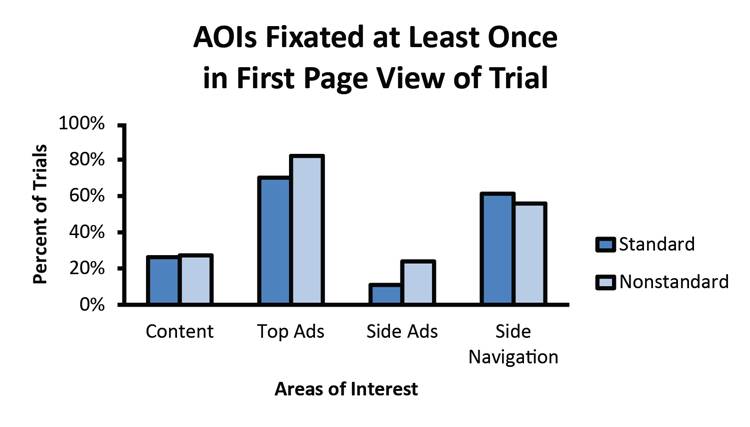
Figure 7. Percentage of trials that participants fixated various AOIs on the website home page.
By examining web pages containing the task target, hints of different search strategies can be determined by comparing the frequency of how often different AOIs were fixated for the two layout conditions. Whether or not an AOI had a single fixation during a view of the target page was calculated. Chi-square tests of association were conducted to compare the AOIs across layouts. Additionally, ANOVAs were conducted to examine dwell time and average fixation duration. The top ad and side ad AOIs were fixated in more target page views using the standard website than the nonstandard website, Χ2 = (1, N = 976) = 7.20, p < .01 and Χ2 = (1, N = 976) = 6.92, p < .01, respectively. However, the side navigation AOI was fixated more often, Χ2 = (1, N = 976) = 5.91, p = .02, and for a longer total dwell time (MD = 250.78, p = .002), Wilks’ Λ = .987, F(3, 972) = 4.39, p = .004, multivariate η2 = .013, in target page views on the nonstandard website than the standard website. This suggests higher text advertising blindness when search strategies become more deliberate in comparison with the first page view of each trial. See Figure 8 for percentage of AOIs fixated on the target pages for standard and nonstandard layouts.
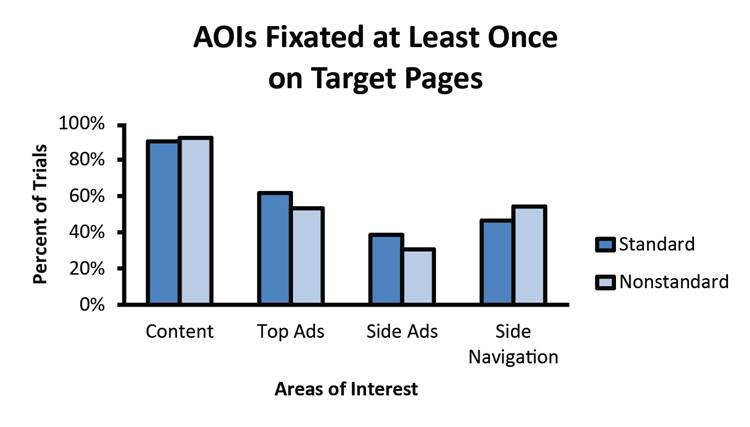
Figure 8. Percentage of trials that participants fixated various AOIs on the web page containing the target.
Fixation Order
The order in which each AOI was fixated can give insights into the search strategies that participants employed. The order in which the four AOIs (content, side navigation, top ads, side ads) were fixated during the first page view (home page) for each trial was calculated. Friedman Chi-Square tests were conducted to determine differences in rank for each layout condition. For participants using the standard website, the fixation order of the AOIs was different, Χ2 (3, N=479) = 546.70, p < .01, W = .38. Post-hoc Wilcoxon signed rank tests showed that the top ads region was viewed significantly earlier than the other AOIs, p < .01. The side navigation was viewed next, followed by the content, while the side ads region was consistently viewed last, p < .01.
Similarly, for users of the nonstandard website, we also observed significant differences in fixation order, Χ2 (3, N=484) = 591.55, p < .01, W = .41. Post-hoc Wilcoxon signed rank tests indicated that the top ads region was viewed significantly before the other AOIs, followed by the side navigation region, p < .001. No differences were found between the fixation order of the content and side ads region. See Figure 9 for a visual depiction of the fixation orders.
These results suggested the presence of text advertising blindness where the side ad region was fixated last in the standard layout but as early as the content region in the nonstandard layout. In both layout conditions, it is not a surprise that the top ads AOI was fixated first, given that the AOI was located in the same position as the task instructions were presented on the previous screen.
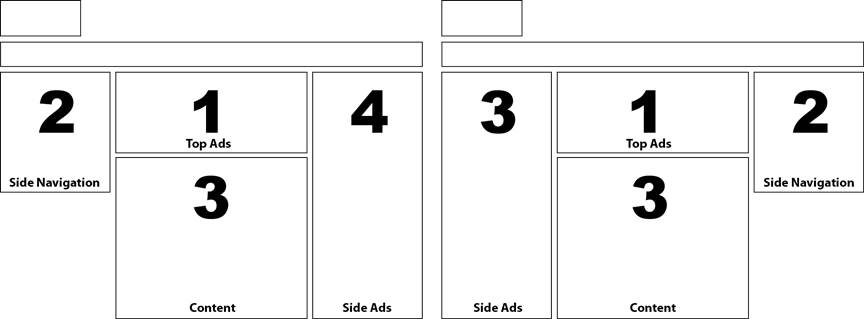
Figure 9. First fixation order for AOIs on the home page of the standard (left) and nonstandard (right) layouts.
The order the four AOIs (content, side navigation, top ads, side ads) were first fixated was calculated for the target page of each trial. Friedman Chi-Square tests indicated that participants using the standard website had significant differences in rank fixation order, Χ2 (3, N=485) = 415.04, p < .001, W = .29. Post-hoc Wilcoxon signed rank tests determined that the content region was viewed significantly before the other AOIs, p < .001. The top ads region was viewed next, followed by the side navigation, and the side ads region was consistently viewed last, p < .01.
Similarly, users of the nonstandard website had significant differences in fixation order, Χ2 (3, N=484) = 523.03, p < .01, W = .36. Post-hoc Wilcoxon signed rank tests determined that the content region was viewed significantly before the other AOIs. The top ads and side navigation regions were equally likely to be fixated next, p < .01, followed by the side ads region being viewed consistently last, p < .01. See Figure 10 for fixation orders. Overall, participants fixated the side ad AOI last in both web page layout conditions, which is similar to the fixation order on the first page view of each trial.
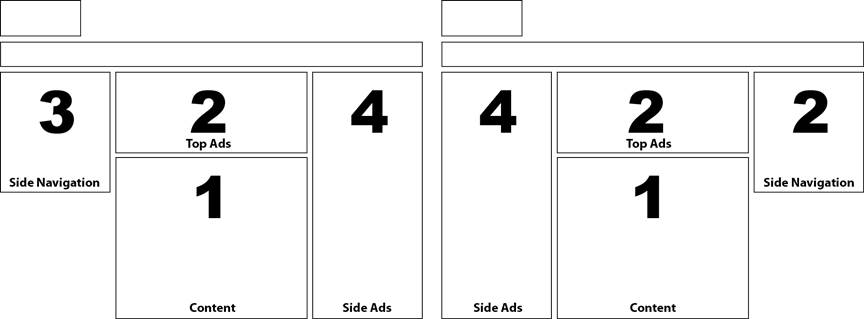
Figure 10. First fixation order for AOIs on the target page of the standard (left) and nonstandard (right) web page layouts.
Fixations Across First Three Trials
These results demonstrated a consistent pattern of text blindness, regardless of the page layout, for the 18 search tasks. Examination of user eye movements on the home page during the first two practice tasks (before the 18 experimental trials) allowed us to see how quickly users adapted to the nonstandard layout. Figures 11 (standard layout) and 12 (nonstandard layout) show heat maps from trials 1-3 for each condition (two practice trials and one experimental trial). Mean fixation counts are provided in Table 1 for the first three trials for each AOI in both the standard and nonstandard layouts. In the nonstandard condition, it appeared that the users had adapted to the right-side navigation by the third trial. The second trial was the first task that required users to explore the navigation to complete the task.
Fixation counts for the side ads and side navigation AOIs were compared to each other by trial for the two layout conditions. In the standard layout, fixation counts on both side ads and side navigation were similar during the first trial, but differed significantly by the second trial, p < .05. In contrast, participants in the nonstandard layout condition did not exhibit differences in fixation counts for the side ad and navigation regions until the third trial, p < .05. Thus, participants in the nonstandard layout condition were more likely to look at the side ad region than those in the standard layout condition, but only for one trial longer. By the third trial, both groups were exhibiting the same pattern of fixation allocation to side ads vs. side navigation.
When comparing the AOIs by layout and trial, only during the second trial was the fixation count significantly greater for the side ads AOI of the nonstandard layout than the standard layout. For all other AOIs, no differences were noted between standard and nonstandard layouts.
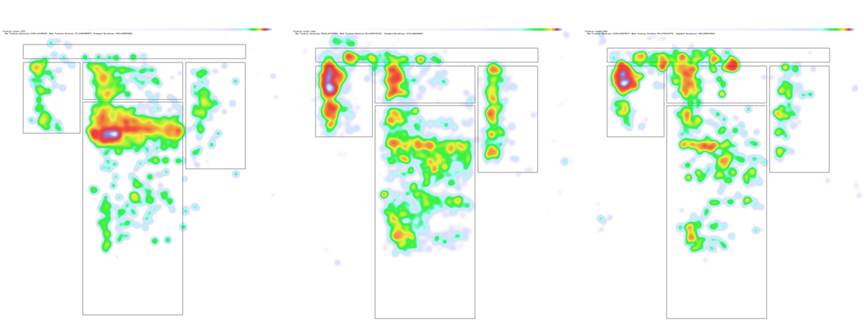
Figure 11. Heat maps of fixations on the home page for the first three trials on the standard layout where navigation was on the left and text ads were on the right.
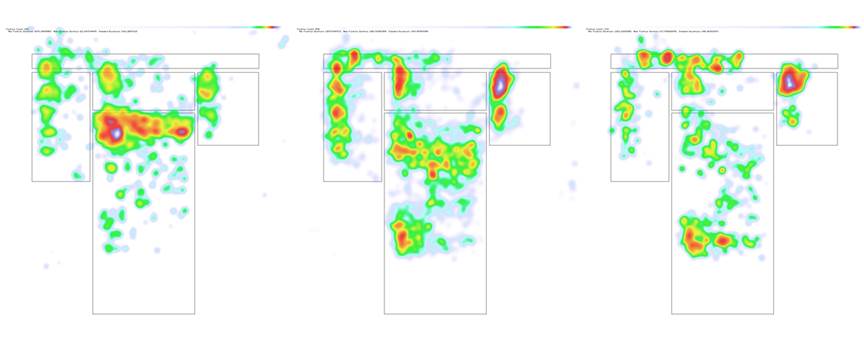
Figure 12. Heat maps of fixations on the home page for the first three trials on the nonstandard layout where text ads were on the left and navigation was on the right.
Table 1. Mean Fixation Count (SD) for the First Three Trials for Both the Standard and Nonstandard Layout Conditions
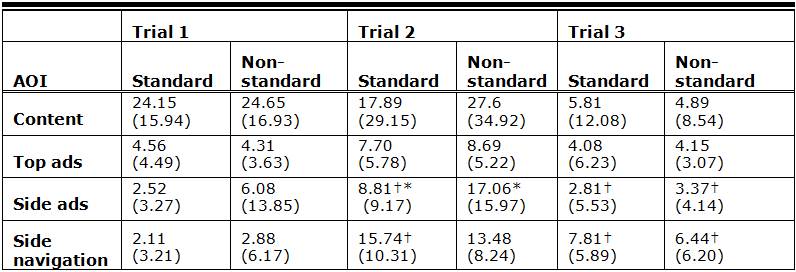
* indicates significant differences in number of fixations between layout conditions, p < .05
† indicates significant differences in fixation counts between trials for side ad and side navigation AOIs, p < .05
Summary
Overall, the results of this study demonstrate that participants using a website with a nonstandard layout were overall less successful at finding search targets; reported slightly higher mental workload; and viewed the side ads area earlier on the home page, but similarly on target pages compared to participants using a standard layout. However, users did not indicate the tasks were significantly more difficult on the nonstandard page and seemed to adapt quickly. In fact, by the third trial, participants spent less time on the text ad portion of the page, indicating that they had already become accustomed to the new navigation link location.
Discussion
The results of this study demonstrate insight into the resilient nature of text advertising blindness and how quickly users can adapt to novel layouts.
Previous research found that advertisements placed on the right side of the page were particularly susceptible to blindness, especially when users were aware the page region was advertising and thus failed to utilize this area for task completion (Owens et al., 2011). One goal of this study was to determine whether text advertising blindness was due to the location of ads on a page or due to their appearance. We initially posited three scenarios where text advertising blindness was specific to either the location of the text advertisements, the appearance of the text advertisements, or a combination of both attributes. The results support the notion that a combination of both location and physical characteristics contribute to text advertising blindness.
Similar to Owens et al. (2011), text advertising blindness was persistent such that users ignored text advertisements, even though they were useful for successful task completion. Similar also, text advertising blindness was more severe in the side advertisements than the advertising region above the content of the website. Finally, the overall effect of text advertising blindness was more pronounced when the advertisements were moved to where navigation is typically found, on the left side of the website. This finding was applicable to both the top and side advertisement regions.
However, while using the standard layout, participants exhibited a small but significant decrease in the degree of text advertising blindness as their experimental session progressed for side ad targets. This did not occur for tasks with search targets located in the top ads region. When using the nonstandard layout, the degree of advertising blindness remained constant and resulted in a gradual increase in user’s ratings of task difficulty over time.
This behavior may be related to how users plan their information searches. Initially, participants had expectations of locations for elements on the website. Based on fixation order and fixations of the side ad and side navigation AOIs, it was evident that participants expected navigation to be on the left side of the page. As with previous literature (McCarthy et al., 2003; Tzadidou et al., 2005; Santa-Maria & Dyson, 2008), participants were able to adapt quickly to violations of website conventions. By the third trial, or about four page views and 90 seconds of interaction with the nonstandard layout of the website, participants adapted to the nonstandard layout with navigation on the right side and text advertisements on the left side.
While their search behavior adapted quickly, there were more long-term effects of violating website conventions in the study. Even though differences in fixation count were extinguished by the third trial, overall differences were noted in fixation order and whether an AOI was fixated for the first page view and the target page of each trial. Typically, the first page view of each trial was for navigational purposes to move to another page on the website in order to locate the target. On the first page of each trial, there was a tendency to view the side ads region more often in the nonstandard layout than the standard layout, but no differences were noted in whether the side navigation region was viewed.
While the website stimulus used in this study was similar to other websites found on the Internet with regard to advertising, layout, and content, it may be considered a limitation of this study. Future studies should examine the pervasiveness of advertising blindness with other types of websites, website layouts, types of convention violations, and advertising formats.
Conclusion
This study provides evidence that text advertising blindness persists even when the text advertisements are located within a region that is typically used for other page elements, such as navigation. In agreement with previous research, users were able to adapt to violated website conventions within a few page views. While they were able to adapt quickly, the convention violation in the nonstandard layout also increased text advertising blindness, decreased task success, decreased the likelihood that the text advertisements were fixated, and increased mental effort.
Advertising on the Internet can be considered an “arms race” between users, who continually ignore and adjust to elements they do not consider useful, and website creators, who continually change advertisement attributes and placement. For these creators, violating prominent conventions in website design to boost text advertising performance may actually increase text advertising blindness and decrease the usability of their website in the process. In this study, it was shown that following website design conventions and having text advertising that was useful to users slightly decreased text advertising blindness over time.
References
- Alexa (2012). Top sites in the United States. Retrieved April 10, 2012 from http://www.alexa.com/topsites/countries/US
- Bangor, A., Kortum, P., & Miller, J. (2009). Determining what individual SUS scores mean: Adjective rating scale. Journal of Usability Studies, 4(3), 114-123.
- Benway, J. P. (1998). Banner blindness: The irony of attention grabbing on the world wide web. In Proceedings of the Human Factors and Ergonomics Society 42nd Annual Meeting (pp. 463-467). Chicago, Illinois: HFES.
- Bernard, M. (2001). Developing schemas for the location of common web objects. In Proceedings of the Human Factors and Ergonomics Society 45th Annual Meeting, Human Factors and Ergonomics Society, 1161–1165.
- Bernard, M. (2002). Examining user expectations for the location of common e-commerce web objects. Usability News, 4(1) Retrieved from http://usabilitynews.org/examining-user-expectations-for-the-location-of-common-e-commerce-web-objects/
- Bernard, M., & Sheshadri, A. (2004). Preliminary examination of global expectations of users’ mental models for e-commerce web layouts. Usability News, 6(2). Retrieved from http://usabilitynews.org/preliminary-examination-of-global-expectations-of-users-mental-models-for-e-commerce-web-layouts/
- Brooke, J. (1996). SUS: A quick and dirty usability scale. In P. Jordan, B. Thomas, B. Weerdmeester, & I. L. McClelland (Eds.), Usability evaluation in industry, (pp. 189-94). London, UK: Taylor & Francis.
- Cooke, L. (2008). How do users search web home pages? An eye-tracking study of multiple navigation menus. Technical Communication, 55(2), 176-194.
- Di Nocera, F., Capponi, C., & Ferlazzo, F. (2004). Finding geometrical associations between meaningful objects in the web: a geostatistical approach. PsychNology Journal, 2(1), 84-98.
- Interactive Advertising Bureau (2012). IAB 2011 Internet advertising revenue report [White Paper]. Retrieved from http://www.iab.net/media/file/IAB_Internet_Advertising_Revenue_Report_FY_2011.pdf
- McCarthy, J. D., Sasse, M. A., & Riegelsberger, J. (2003, September). Can I have the menu please? An eye tracking study of design conventions. In Proceedings of HCI 2003 (pp. 401-414). Bath, UK.
- Owens, J. W., Chaparro, B. S., & Palmer, E. M. (2011). Text advertising blindness: The new banner blindness? Journal of Usability Studies 6(3), 172-197.
- Santa-Maria, L., & Dyson, M. C. (2008). The effect of violating visual conventions of a website on user performance and disorientation. How bad can it be? In Proceedings of SIGDOC (pp. 47-54).
- Sauro, J., & Dumas, J. S. (2009, April). Comparison of three one-question, post-task usability questionnaires. In Proceedings of CHI 2009. Boston: ACM Press.
- Shaikh, A. D., Chaparro, B. S., & Joshi, A. (2006). Indian users’ expectations for the location of web objects on informational websites. In Proceedings of the Human Factors and Ergonomics Society 50th Annual Meeting, Human Factors and Ergonomics Society (pp. 1922–1926).
- Shaikh, A.D., & Lenz, K. (2006). Where’s the search? Re-examining user expectations of web objects. Usability News, 8(1). Retrieved from http://usabilitynews.org/wheres-the-search-re-examining-user-expectations-of-web-objects/
- Tzanidou, E., Petre, M., Minocha, S., & Grayson, A. (2005). Combining eye tracking and conventional techniques for indications of user-adaptability. INTERACT 2005, 753-766.