
Abstract
This study presents an evaluation of user performance and satisfaction of three physical keyboards that accompany two popular tablet computers. All keyboards were dual purpose in that they served as tablet covers in addition to typing input devices. The keyboards varied in weight, thickness, and key travel. The thinnest keyboard featured durability and pressure-sensitive keys while the other two keyboards were slightly thicker, but used mechanical keys. Participants unfamiliar with the keyboards were asked to type a series of phrases on each keyboard after a short practice. Typing performance, and perceived usability and workload were assessed. Results show a clear advantage in both performance and satisfaction for the mechanical-key keyboards. Users demonstrated typing speeds approximately 10 words per minute (WPM) slower and were prone to typing errors such as incorrect key substitutions, omissions, and inadvertent insertions with the thinner, pressure-sensitive keyboard. In addition, users reported the flat keyboard was more mentally demanding, more frustrating, and required more effort to use. Results from this study reveal the importance of tactile feedback to user typing performance and satisfaction. Designers of tablet physical keyboards must assess the tradeoff between optimal keyboard size, weight, and thickness, and a design that affords accurate typing.
Tips for Usability Practitioners
The following are suggestions for usability practitioners:
- Allow participants to adjust their chair height and to move the keyboards into a comfortable position when testing keyboard typing performance.
- Allow participants to practice typing with the keyboard before measuring performance, even when assessing first-time usage.
- Have participants read the phrase they are to type aloud to make sure they understand it before beginning a typing trial.
- Use test phrases with both numbers and symbols to mimic real-world typing.
- Use of a simple stopwatch is accurate enough to measure differences in typing speed.
- Consider using a 50-point scale to provide ratings and rankings when you compare three or more products.
Introduction
Touchscreen devices have increased in popularity due to the success of smartphones and tablet computers. Analysts expect sales of tablet devices to overtake PCs before the end of 2013 (Sherman, 2013). Even with their popularity, tablets and smartphones are still less efficient than traditional desktop computers and laptops in certain aspects, such as text input. One major difference in text input between tablets and desktops/laptops lies in the keyboard—we use physical keyboards for desktops/laptops and onscreen (virtual) keyboards for touchscreen devices. Slow and/or inaccurate text input has been noted as one drawback to touchscreen devices (Findlater & Wobbrock, 2012).
User interaction with onscreen keyboards has been compared to traditional keyboards in a number of studies (Chaparro, Nguyen, Phan, Smith, & Teves, 2010; Kim, Aulck, Bartha, Harper, & Johnson 2012; Kim, Aulck, & Johnson, 2012; Varcholik, LaViola & Hughes, 2012). Findings revealed that use of the touchscreen keyboard results in increased musculoskeletal discomfort, decreased typing performance, increased errors, and lower user satisfaction. Findlater and Wobbrock (2012) noted that one problem with touchscreen keyboards is that they are prone to error from inadvertent touches. To accommodate the problems with touchscreen typing, tablet manufacturers are offering physical keyboards as accessories for their devices.
Given that one of the biggest benefits of the tablet computer is its portability, users want any additional accessories to be lightweight and unobtrusive. The Microsoft Surface RT and Pro offer two external keyboard solutions: Type Cover and Touch Cover. The Touch Cover is a very flat standard QWERTY keyboard promoted for its durability and lightweight design. To achieve this design, the keyboard uses pressure-sensitivity to register key presses rather than mechanical keys. The Type Cover keyboard is twice as thick and is slightly heavier and uses mechanical keys. Trade reports suggest that typing performance may perhaps be influenced by the key design (Phillips, 2012).
Chaparro, Phan, and Jardina (2013) compared typing performance between the Touch Cover keyboard and the onscreen keyboard of two tablets (iPad, Surface RT). Results showed that users typed faster with the Touch Cover keyboard than either onscreen keyboard, but also committed more typing errors. Users commented that the lack of tactile and auditory feedback contributed to the errors. Omission and spacing errors were especially problematic and more prevalent compared to the onscreen keyboards. Users thought they had typed a character, but it was not recognized by the keyboard. Overall, users indicated that while the layout of the Touch Cover was optimal (especially for numbers and symbols) they preferred the sensitivity of the iPad onscreen keyboard and the sound feedback of the Surface onscreen keyboard. This study was interesting in that it showed that an external keyboard comparable to an onscreen keyboard in terms of portability resulted in better typing performance, but lower user satisfaction. It is not known, however, how user performance and satisfaction/preference of other external keyboard designs compare.
This study builds on earlier research by examining user performance, satisfaction, and preference of three physical tablet keyboards that varied in size and key travel distance (the distance one must press a key to enter a character).
Method
The following sections discuss the participants, materials, and procedures used in this study.
Participants
A total of 16 participants (7 males and 9 females) participated in the study. Participants were recruited from a mid-western university and ranged in age from 18-35 years old (M = 22.13; SD = 4.44). Participants reported using a laptop or desktop computer on a daily basis. Half of the participants reported to be touch typists while the remaining participants claimed that they sometimes needed to see the keyboard to type accurately. None of the participants had experience with the keyboards evaluated in this study.
Materials
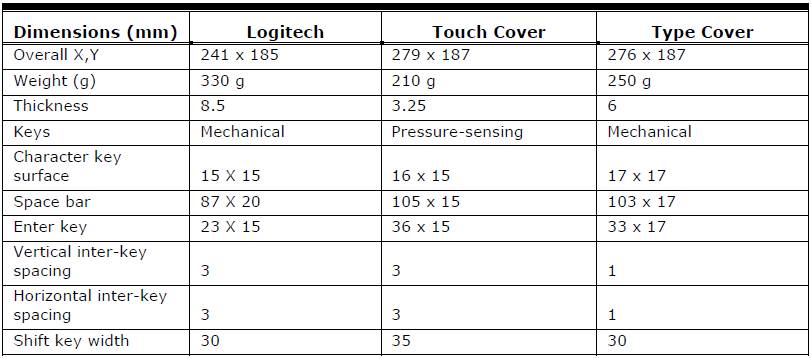
This study evaluated three keyboards: the Logitech Ultrathin Keyboard Cover for the iPad, Microsoft Surface Pro Type Cover, and Microsoft Surface Pro Touch Cover (see Figure 1). Dimensions for each keyboard are provided in Table 1. Autocorrect settings were disabled within the notepad applications used in the Surface Pro and the iPad so that the accuracy of only the keyboard could be assessed. Auditory feedback from each keyboard varied based on the nature of the key design. The two mechanical-key keyboards generated a key “click” sound with each key press, while the pressure-sensitive keyboard generated a “tap” sound with each key press. Participants were presented phrase sets that consisted of two short sentences adapted from phrases originally developed by Mackenzie and Tanaka-Ishii (2007). Phrases included letters, digits, and symbols so that full use of the keyboard could be assessed. These phrase sets were randomized and displayed using a Microsoft Visual Basic program. Time completions for each trial were recorded with a stopwatch.
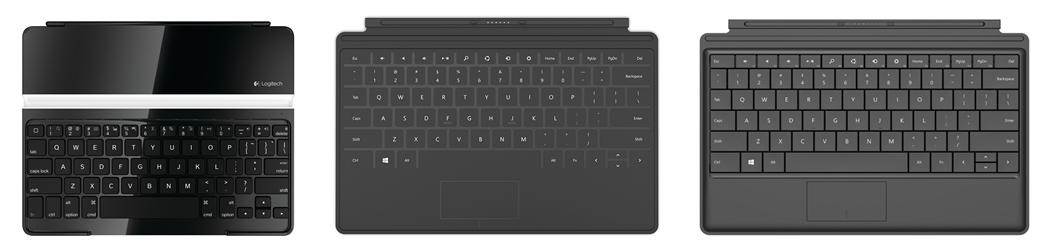
Figure 1. The keyboards evaluated in this study (left to right): Logitech Ultrathin Keyboard Cover for iPad, Microsoft Surface Touch Cover, and Microsoft Surface Type Cover.
Table 1. Keyboard Dimensions (mm unless otherwise noted)
Procedure
Participants were informed that the purpose of the study was to evaluate three tablet keyboards by performing typing tasks. The typing tasks consisted of four blocks of five phrases (total of 20 trials for each keyboard). The first block served as practice and was not included in the final analysis. The order of keyboards and phrases were partially counterbalanced across participants.
Participants were asked to read aloud each phrase before starting each trial. Participants were instructed to type the phrases, presented one at a time on a computer monitor, into a Notepad application as accurately as possible while maintaining their normal typing speed. Corrections in punctuation, capitalizations, and/or word spaces were not permitted, and participants were instructed to type the phrase without backspacing. Tablets remained stationary on a table top, but participants were allowed to adjust the height of their chairs and move the keyboards forward or back to facilitate a comfortable typing position.
After typing all phrases for each keyboard, participants assessed their subjective mental workload using the NASA Task Load Index and satisfaction with a modified System Usability Scale (SUS; Brooke, 1996). The SUS modification involved changing the word “system” to “keyboard.” Upon completion of the typing tasks on all three keyboards, users were asked to rate the keyboards on a 50-point scale according to eight different attributes—keyboard size, key size, key spacing, layout, sensitivity/responsiveness, accuracy, tactile feedback, sound feedback—and an overall preference. The 50-point scale was five feet in length. Participants placed each keyboard on the scale in a position corresponding to their rating (Figure 2). We find that this technique gives us a better idea of the magnitude of the differences in preference, while at the same time provides a ranking of the items. For example, when we evaluate three or more items we may find that one very poor product is placed on a 1 and the rest in the 40-50 range. This magnitude could be generated with a 7- or 9-point scale, but we believe that the fact that users can physically place the product on the scale and manipulate it stimulates them to not only carefully think about their preferences but also provide higher quality verbal comments.
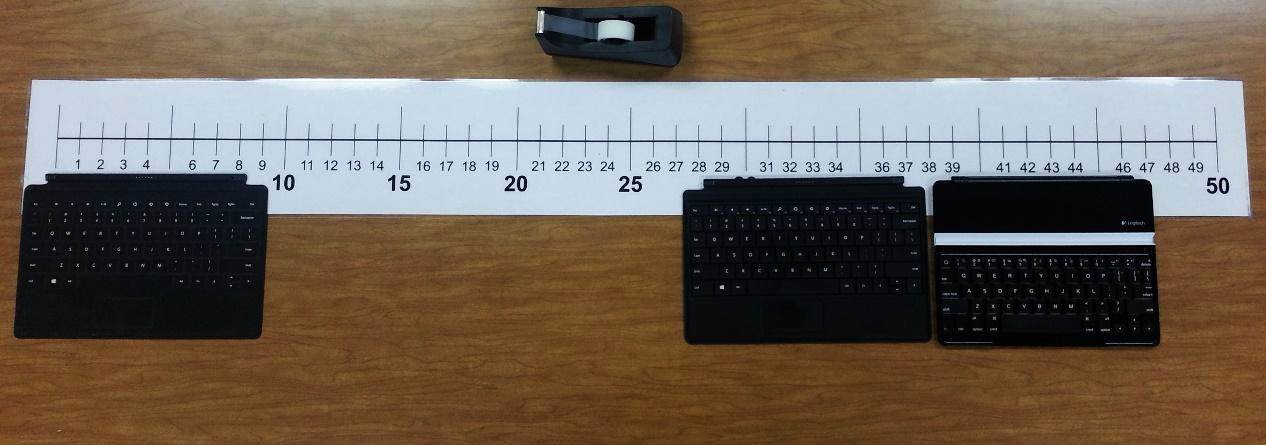
Figure 2. Participants rated the keyboards using a 50-point scale.
Dependent measures
The following dependent measures were collected and analyzed for all three keyboards:
- Typing Performance: Words per minute (WPM), adjusted words per minute (AdjWPM)
- Error Rate:
- Substitution errors (characters other than what was intended)
- Insertion errors (extra character)
- Omission errors (character omitted)
- Word space (extra or omitted space)
- Perceived Workload Assessment: NASA Task Load Index (NASA TLX)
- Satisfaction: System Usability Scale (SUS) and user comments
- Preference: By attribute (keyboard size, key size, key spacing, layout, sensitivity/responsiveness, accuracy, tactile feedback, and sound feedback) and overall preference
Results
The following sections discuss the study results for typing performance, error rate, perceived mental workload, satisfaction, and keyboard attribute preference
Typing Performance
Typing performance for each set of 15 phrases across the three keyboards was analyzed in speed and accuracy as per MacKenzie and Tanaka-Ishii (2007). Words per minute was calculated as
(WPM = 12*(T-1)/S where T = the number of transcribed characters and S = the number of seconds. Adjusted words per minute was calculated as AdjWPM = WPM * (1-U) where U = the uncorrected error rate. Error frequencies were collected from the four error types (substitution, omission, insertion, and word space). Speed was reflected in WPM and AdjWPM. A series of one-way repeated measures ANOVA was conducted to compare measures across the three keyboards. Post-hoc analyses were conducted with Bonferroni correction where appropriate. In cases where the Mauchly’s sphericity test showed the sphericity assumption was not met, p < .05, the Greenhouse-Geisser correction was used (this correction modifies the degrees of freedom to reduce the probability of committing a Type 1 error; Girden, 1992).
WPM
Results from the analysis comparing typing speed revealed a significant difference between the three keyboards, F(1.28, 19.18) = 9.98, p < .01, Wilks’ Λ = .56, partial η2 = .40. Post-hoc analysis showed that the Logitech keyboard (p < .05) and Surface Type Cover keyboard (p < .01) yielded significantly faster typing speeds than the Surface Touch Cover. No differences in typing speed were found between the Logitech and Surface Type Cover keyboards (p > .05).
AdjWPM
Similar results were found in the analysis comparing adjusted typing speed, F(1.37, 20.55) = 9.77, p < .01, Wilks’ Λ = .53, partial η2 = .39. Post-hoc analysis revealed that AdjWPM was faster on the Logitech keyboard (p < .01) and Surface Type Cover (p < .05) than the Touch Cover keyboard. There were no significant differences in typing speed found between the Logitech and the Surface Type Cover keyboards (p > .05; see Figure 3).
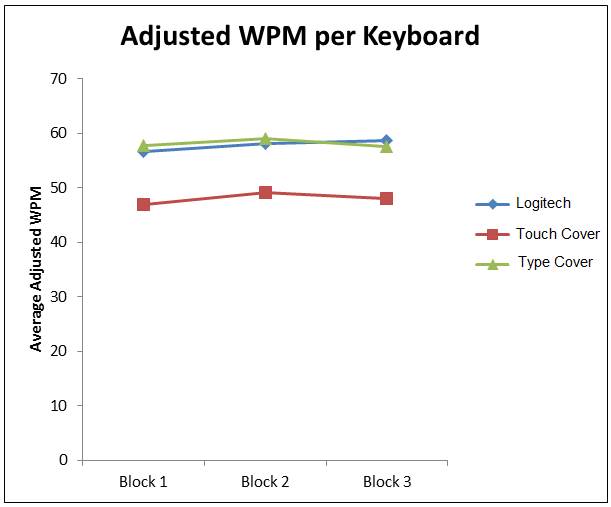
Figure 3. Adjusted typing speed across keyboards.
Error Rate
Error rates across each keyboard were calculated based on the total number of character errors divided by the total characters entered. The most frequent error was substitution followed by omission, insertion, and word space (see Figure 4). There were significant differences in error rate across the three keyboards, F(1.08, 16.24) = 8.95, p < .01, Wilks’ Λ = .48, partial η2 = .37. Post-hoc analysis showed participants made more errors on the Touch Cover keyboard (6.86%) than the Logitech (2.97%) and Type Cover (3.17%).
Analysis of error rates across keyboards yielded significant differences for substitution errors [F(1.03, 15.40) = 6.25, p < .05, Wilks’ Λ = .70, partial η2 = .30], insertion errors [F(1.24, 18.64) = 4.31, p < .05, Wilks’ Λ = .68, partial η2 = .22], and omission errors [F(1.17, 17.55) = 4.51, p < .05, Wilks’ Λ = .33, partial η2 = .23]. No differences were found in word space errors across the three keyboards. The Touch Cover keyboard yielded more substitution, insertion, and omission errors than the other two keyboards.
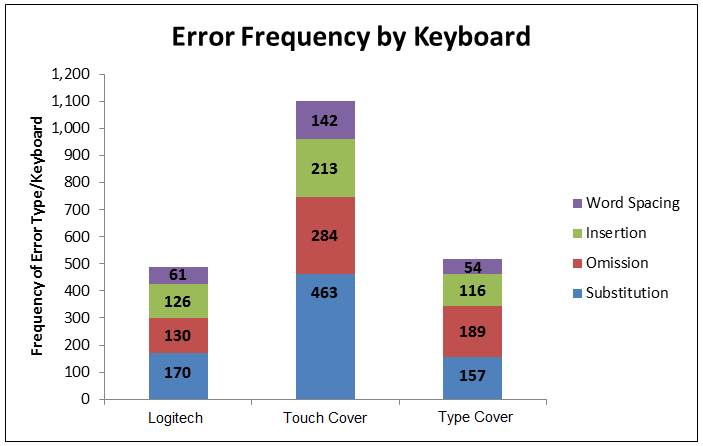
Figure 4. Total frequency of error type per keyboard.
Perceived Mental Workload
Subjective workload was assessed on a 21-point scale for the six dimensions of the NASA TLX dimension (mental demand, physical demand, temporal demand, performance, effort, and frustration). Figure 5 shows a summary of the participants’ perceived workload for each dimension and keyboard. Results showed significant differences in mental demand [F(1.41, 21.17) = 7.73, p = .01, Wilks’ Λ = .47, partial η2 = .34], performance [F(2, 30) = 15.30, p < .01, Wilks’ Λ = .30, partial η2 = .50], effort [F(2, 30) = 5.21, p < .01, Wilks’ Λ = .64, partial η2 = .26], and frustration [F(2, 30) = 7.16, p < .01, Wilks’ Λ = .51, partial η2 = .32]. Users reported the Surface Touch Cover keyboard was more mentally demanding and frustrating to use, and required more effort. Users also reported that they performed the worse on the Touch Cover keyboard compared to the Logitech and Type Cover keyboard. No differences in physical and temporal demand were found.
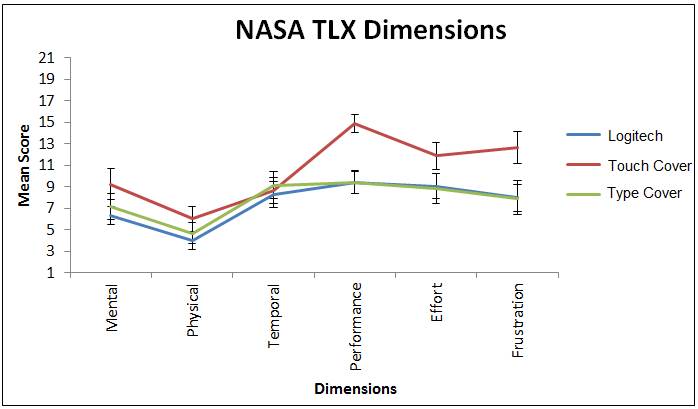
Figure 5. Perceived workload associated with keyboard use. Scale range from 1 to 21, with lower numbers indicating lower perceived workload or better performance.
Satisfaction
Satisfaction scores were calculated on a 0 to 100 scale using an adapted version of the System Usability Scale (SUS). Higher scores on the scale indicate a higher level of satisfaction. A SUS score above 68 is considered average or marginally acceptable (Bangor, Kortum, & Miller, 2009). Mean satisfaction scores were 75.47 (SD = 16.41) for the Logitech, 34.22 (SD = 20.81) for the Touch Cover, and 67.97 (SD = 20.27) for the Type Cover. Results from a one-way repeated-measures ANOVA showed that differences were statistically significant, F(2,30) = 19.88, p < .01, Wilks’ Λ = .29, partial η2 = .57. Users were more satisfied with the Logitech and Surface Type Cover keyboard than with the Surface Touch Cover (see Figure 6).
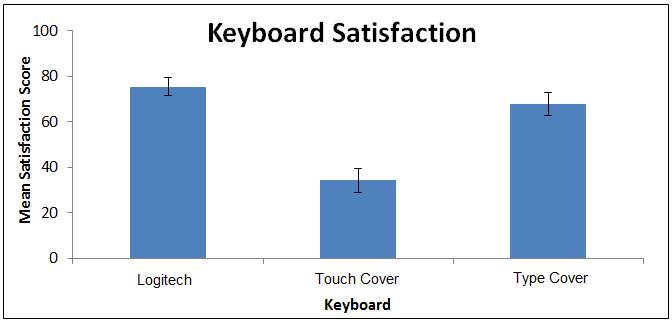
Figure 6. Mean satisfaction score per keyboard. Error bars represent +/- 1 standard error.
Preference of Keyboard Attributes
Users rated the three keyboards on eight different attributes (keyboard size, key size, key spacing, layout, sensitivity/responsiveness, accuracy, tactile feedback, and sound feedback) as well as an overall keyboard preference on a 50-point scale (1 = least preferred, 50 = most preferred; see Figure 7).
Results revealed significant differences among the three keyboards on six of the eight attributes (keyboard size, key size, sensitivity/responsiveness, accuracy, tactile, and sound feedback) and overall keyboard preference (see Table 2). No differences were found for key spacing and layout.
Table 2. Statistics Results of Significant Attributes
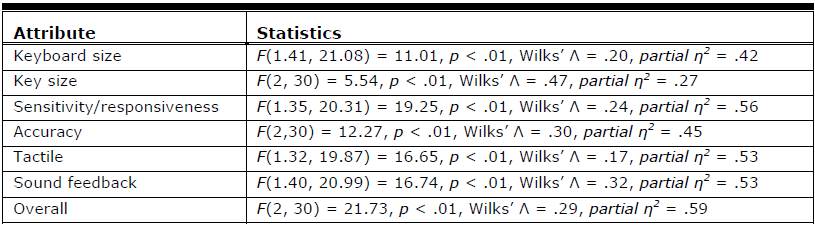
Post-hoc analyses revealed the following:
- Keyboard size: Type Cover and Touch Cover preferred over Logitech
- Key size: Type Cover preferred over Touch Cover and Logitech
- Sensitivity/responsiveness: Type Cover and Logitech preferred over Touch Cover
- Accuracy: Type Cover and Logitech preferred over Touch Cover
- Tactile: Type Cover and Logitech preferred over Touch Cover
- Sound feedback: Type Cover and Logitech key press “click” preferred over Touch Cover “tap”
- Overall: Type Cover and Logitech preferred over Touch Cover
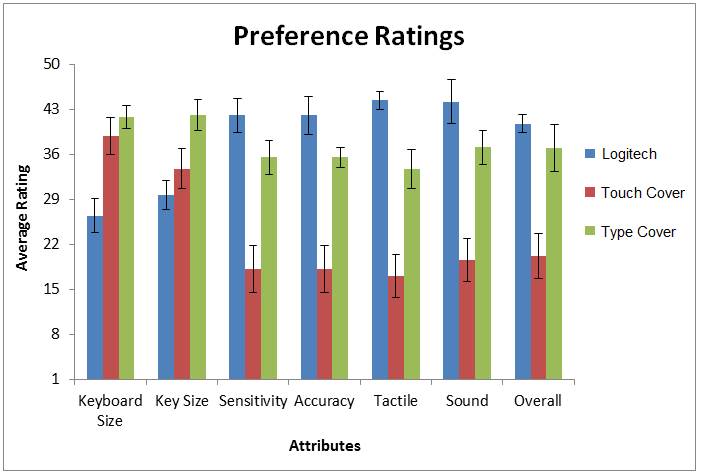
Figure 7. Keyboard preference by attribute (50 = most preferred).
Conclusion
Results from this study demonstrate that participants, on first-time use, typed faster and more accurately on the keyboards that have mechanical keys than the keyboard with the pressure-sensitive keys. In addition, they were more satisfied and perceived lower mental workload with mechanical key keyboards. It appears that providing the benefit of lower weight, less thickness, and durability result in a performance and satisfaction cost that could be detrimental to overall tablet usability.
Previous research by Chaparro, Phan, and Jardina (2013) showed that participants were able to type faster on the pressure-sensitive keyboard used in this study than onscreen tablet keyboards. Those authors discovered the same error-prone performance however. The present study provides further evidence that typing performance can be less prone to error and more satisfying when the keyboard offers tactile key feedback, even if the weight and thickness is slightly increased.
While the participants in this study did not perform differently overall with either mechanical key keyboard, they did note several features that impacted their assessment of satisfaction and effort. Some participants commented that the Logitech keyboard felt “cramped” compared to the Type Cover. The Type Cover was wider in overall size and offered an extension on which users could rest their hand/wrist while typing.
This study examined first-time usage of three tablet keyboards. While these results are valuable given that many users may make their decision to purchase a keyboard based on such first impressions, future research should examine typing performance between touch and non-touch typists as well as examine performance over time for a variety of typing tasks. It is possible that performance with the pressure-sensitive keyboard may improve with practice. Three different keyboards were assessed so that external validity could be maximized to everyday tablet usage. Future research could isolate the impact of key travel distance specifically by using the same keyboard design with key travel manipulated systematically. This could provide keyboard designers specific guidelines on how much travel is necessary to facilitate optimal typing performance and user satisfaction.
References
- Bangor, A., Kortum, P., & Miller, J. (2009). Determining what individual SUS scores mean: Adding an adjective rating scale. Journal of Usability Studies, 4(3), 114-123.
- Brooke, J. (1996). SUS-A quick and dirty usability scale. In P.W. Jordan, B. Thomas, B. A. Weerdmeester, & I.L. McClelland (Eds.), Usability Evaluation in Industry (pp. 189 – 194). London: Taylor & Francis.
- Chaparro, B. S., Nguyen, B., Phan, M., Smith, A., & Teves, J. (2010). Keyboard performance: iPad versus Netbook. Usability News [online] http://usabilitynews.org/keyboard-performance-ipad-versus-netbook/
- Chaparro, B. S., Phan, M., & Jardina, J. R. (2013). Usability and performance of tablet keyboards: Microsoft Surface vs. Apple iPad. In Proceedings of the Human Factors and Ergonomics Society International Annual Meeting (Vol. 57, No. 1, pp. 1328-1332). SAGE Publications.
- Findlater, L., & Wobbrock, J. O. (2012). From plastic to pixels: In search of touch-typing touchscreen keyboards. Interactions, 19(3), 44-49.
- Girden, E. R. (1992). ANOVA: Repeated measures (Sage University Paper Series on Quantitative Applications in the Social Sciences, series no. 07-084). Newbury Park, CA: SAGE Publications.
- Kim, J. H., Aulck, L., Bartha, M. C., Harper, C.A., & Johnson, P. W. (2012). Are there differences in force exposures and typing productivity between touchscreen and conventional keyboard? In Proceedings of the Human Factors and Ergonomics Society International Annual Meeting (Vol. 56, No. 1, pp. 1104-1108). SAGE Publications.
- Kim, J. H., Aulck, L., & Johnson, P. W. (2012). Are there differences in muscle activity, subjective discomfort, and typing performance between virtual and conventional keyboard? In Annual International Conference of the IEEE Engineering in Medicine and Biology Society (Vol. 2012, pp. 4764-4767).
- MacKenzie, I. S., & Tanaka-Ishii, K. (2007). Text entry systems: Mobility, accessibility, universality. New York: Morgan Kauffman.
- Phillips, J. (2012). Touch Cover vs. Type Cover: Empirical test data doesn’t lie! Retrieved July 2013 from http://www.techhive.com/article/2012903/touch-cover-vs-type-coverempirical-test-data-doesn-t-lie.html
- Sherman, J. (2013). Tablet sales on the rise, to surpass PCs by the end of year. Retrieved May 9, 2013 from http://www.digitaltrends.com/mobile/tablet-sales-on-the-rise-to-surpass-pcs-by-end-of-year/
- Varcholik, P. D., LaViola, J. J., & Hughes, C. (2012). Establishing a baseline for text entry for a multi-touch virtual keyboard. International Journal of Human-Computer Studies, 70(10), 657-672.
Download Article
User Performance and Satisfaction of Tablet Physical Keyboards