
Abstract
In the Oracle Fusion User Assistance group, we are always interested in how to communicate information more effectively to users. In this particular set of studies, we wanted to study the use of comics as user assistance. Comics are easy to create with a number of free, online tools. Two studies examined how comics can be used to convey both task-based and conceptual information. In the first study, participants were shown a new feature in a software application—both in the form of a comic and in the form of a PowerPoint presentation. Both contained the same information. Based on the information in the training materials, the participants then performed tasks in a functional prototype of a Human Capital Management tool. Participants preferred the comic on two usability scales.
In the second study, the Darwin Information Typing Architecture (DITA) authoring and publishing model was presented to an audience of technical writers. Respondents were asked to view each of three information formats for the same information: metaphor- and non-metaphor-based comics and a Microsoft PowerPoint presentation. Metaphor-based comics scored better than the other two formats on usability scale ratings and on a multiple-choice test.
These studies suggest that the novel and affective format of a comic book should be considered as an alternative to more traditional training materials.
Practitioner’s Take Away
The following are some tips for usability professionals:
- Participants grasped information more quickly using comic strips rather than the more traditional slide presentations. Using comics to introduce information, such as participant study instructions, can be an effective and engaging tool.
- Comics can be created using intuitive tools that are available at no cost on the Internet. Websites such as Design Comics (www.designcomics.org) were specifically created for use by practitioners to convey design ideas, scenarios, and even report user studies. Practitioners should consider using comics in a variety of areas, including usability reporting.
- The use of metaphors within a comic can provide additional benefit to the understanding of information.
Introduction
Comics, defined as “juxtaposed pictorial and other images in deliberate sequence, intended to convey information and/or to produce an aesthetic response in the viewer” (McCloud, 1993, p. 20), are now a popular form of instruction and technical communication—a powerful way of visually communicating structure, relationship, and flow (Hughes, 2009). Comics now communicate a broad range of messages, from smoothing international relations to obtaining temporary resources for a large national or international company (enterprise business) (McCurry, 2008; Odesk.com, 2011). Comics are regarded as an important form of communication, offering a powerful and meaningful way to tell users of information technology about new features, best practices, concepts, and usage procedures (Andriessen, Kliphuis, McKenzie, & Van Winkelen, 2009). Adopting a plain language adaptation of McCloud’s 1993 definition, Porter (2010) posited that comics convey their message to readers in a way that allows readers to recognize and relate to comics on a different, more emotional way than other traditional forms of technical communication, such as documentation and help systems. Pratt (2010) firmly positions comics as affective technical communication, part of an emotional user experience designed to engage users more with products and services, as well as to answer their questions. Manga (Japanese comics) guide users on everything from database administration to statistics to physics (Nitta, Takatsu, & Trend-Pro Ltd, 2009; Takahashi, Azuma, & Trend-Pro Ltd, 2009; Takahaski & Trend-Pro Ltd, 2008). Comics have been used to convey legal information and to show how to use the Information Technology Infrastructure Library (http://www.manageengine.com/products/service-desk/itil-whitepaper.html).
Comics as a Teaching Device
Comics are now regularly encountered globally as they are embraced by education systems from elementary schools to Ivy League colleges (Davidson, 2008; EduComics: Using Web Comics in Education, 2010; Gerde, & Foster, 2007). The complexity of their use has advanced from one of a “debased form of word-based literacy” to a complex textual environment that relies on users making meaning of not just words, but also other visual elements, gestural, and spatial aspects (Jacobs, 2007, p. 19). Comics offer the potential for making studies more relevant to students, instructors, and academics in sociology courses (Hall & Lucal, 1999), as well for making studies more engaging, accessible, fun to read (Hall, 2011), and developing inferences and solutions to problems (Kneller, 2009). Comics provide a source of inquiry even into brain injuries (Kamp, Slotty, Sarikaya-Seiwert, Steiger, & Hänggi, 2011), physiology (Zehr, 2011), and copyright law (Duke Law Center for the Study of the Public Domain, 2006). Research into cartoon-based teaching of concepts shows the effectiveness of comics in creating focused discussions and remedying misconceptions by students (Kabapinar, 2005). Importantly, however, success is not standalone, but also stems from the quality of the delivery and interactions around the content.
Comics and the Enterprise Business
Comics are big business; the US comic book market is estimated as earning $680-710 million in 2008 (Kneller, 2009).
Comics are also encountered in enterprise business to communicate, discuss, and critique issues in business ethics and social issues in management, popularized by the satirical Dilbert comic strip (http://www.dilbert.com/). Topics include diversity and teamwork, leadership, marketing, internationalization of marketing, technology, and so on (Gerde & Foster, 2007).
Comics are used by enterprises to promote their products and services either directly (as a form of advertising and marketing) or through product placement in a comic strip. Businesses can also use comics to explain how to use a product or how to resolve problems after the purchase of a product (Cheng, 2008). Consumer research shows how visuals convey more detail, analogous to “writing in more detail” (Scott & Vargas, 2007, p. 342).
Within the enterprise, comics are used to instruct employees about internal organization procedures and process, as well being used as assistance for users of technology used by the business.
Comics as Technical Communications
Comics have entered the mainstream as a form of technical communication and are no longer considered a lightweight comedy subject. They can be widely produced as an alternative to the failings of “tech speak” technical communications (Sedaca 2007). Comics have been used to convey new information in the form popularized by Scott McCloud’s adaptation for the Google Chrome browser (http://www.google.com/googlebooks/chrome). Further examples of comics being used to communicate concepts in information design range in approaches from The Oatmeal’s irreverent comics (http://theoatmeal.com/comics/shopping_cart 2011) to the more nuanced and measured use by Hardee (2011).
The Studies
In the first of two studies presented here, participants were presented information about a new feature in a software application—both in comic format and in the more traditional format of a PowerPoint presentation. Based on the information in these materials, participants were asked to perform several tasks in a functional prototype of a Human Capital Management software application. Following the task performance, these participants were asked to evaluate the materials on two usability rating scales.
The second study evaluated the effectiveness of two types of comics and a PowerPoint presentation in explaining conceptual information about the Darwin Information Typing Architecture (DITA) to an audience of technical writers.
User Assistance and Enterprise Applications
Oracle Corporation offers enterprise applications (CRM and ERP) worldwide. User assistance (help, documentation, and multimedia demonstrations) delivered with the software explains concepts and procedural tasks to users, as well as offering examples of best use. Providing more effective user assistance to increase user productivity, reduce downtime, and increase adoption rates (Webb, Matsil, & Sauro, 2011) provided the impetus for the first part of this research.
Darwin Information Typing Architecture
DITA is an OASIS standard, XML-based data model for authoring and publishing. The architecture emphasizes the importance of reuse of content and working at the level of discrete “standalone” topics. Topics can be easily recombined into different deliverables by use of maps. Formatting of text is applied by different rendering or transformation technologies. Other XML-based approaches focus on longer, book-style chapters (such as the SGML-derived DocBook) or styling and formatting (such as commonly done with Microsoft Word’s style menu or toolbar options).
Oracle uses DITA (Ó Broin & Spradley, 2009) for the authoring of help content delivered with its enterprise applications software. The need to educate and train increasing numbers of technical writers and usability professionals worldwide about DITA provided the impetus for the second part of this research.
Study 1: Task-Based Comics
Nine managers who had conducted performance evaluations of their direct reports participated in the study conducted at the Alliance 2011 conference (an Oracle User Group Conference). These managers were technical group leaders at public universities who were responsible for the integration of Oracle products for use in their organizations. They were not usability experts. There were four women and five men. Other demographic information was not collected.
The participants were shown a PowerPoint presentation in which there were slides describing a new feature for performance evaluations in Human Capital Management (HCM) software. The participants were also shown a comic with the same information about the new feature (see Figure 1), with the exception that the comic added a narrative between two characters discussing the feature. One character described and demonstrated the new feature to the other character. The comics were developed using a set of characters developed by the I See Design (ISD) Group that were made available on Design Comics (http://www.designcomics.org/).
The order of presentation was partially counterbalanced. Following each presentation, participants used the HCM software prototype to perform tasks described in the materials that they viewed. Finally, participants were asked to evaluate the materials on two usability scales. The first was a four-question software usability scale used internally at Oracle that was modified for the presentation of training material, substituting the words “training materials” for the word “software.” This scale asked about the perceived ease of use, attractiveness, usefulness, and understandability of the materials. The second, also modified for training material instead of software, was the System Usability Scale (SUS; Brooke, 1996). The SUS is a simple, widely used 10-statement survey. It was developed by Brooke in the 1980s as a means of getting a quick subjective measure of system usability. Users are asked to rate their level of agreement or disagreement to 10 statements about the software. In our case, we replaced “software” with “training materials,” but otherwise left the scale the same. Because 5 of the 10 questions were worded negatively and the other 5 were worded positively, we used an Excel scoring template that turns the raw individual survey ratings into a single SUS score. This template was based on Brooke’s standard scoring method (ratings were standardized to a common 0-4 rating, then multiplying the sum by 2.5 to get a score that can range from 0-100). The participants were able to perform all tasks in the prototype (that is, success rates were 100%). There were no other differences in performance or perceived usability in this study. The focus for this study was on the users’ perceptions of the usefulness and usability of the different types of training materials.
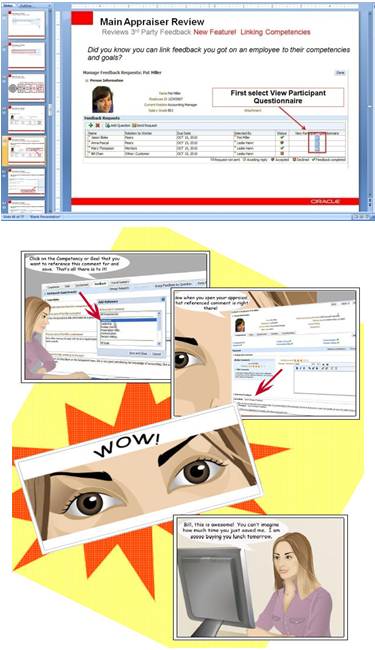
Figure 1. Examples of the PowerPoint presentation (top) and a page from the comics (bottom) showing how to perform a task in the HCM software
Task-Based Comic Findings
Overall, participants preferred the use of the comics to present task-based information. We measured this preference first using the Oracle Universal Scale (OUS). This scale has four questions that are answered by choosing a number from 1 (less of the quality) to 7 (more of the quality):
- Overall, how easy or difficult was it to use the training material? (Ease of Use)
- How attractive was its appearance? (Attractive)
- How useful did you find the information in the training material? (Useful)
- How clear and understandable was the training material? (Understandable)
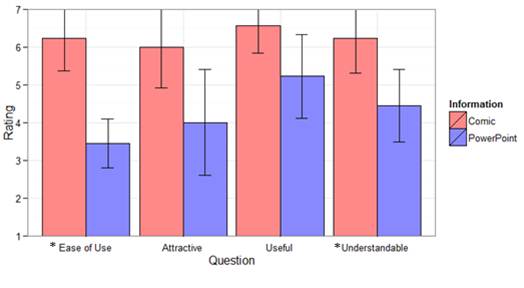
Figure 2. Average OUS question ratings for Comic and PowerPoint conditions. Error bars show the 95% confidence interval, corrected for within subjects design using the R statistics package1. Error bars are truncated at the maximum rating of 7. An * next to the OUS Question name indicates that the difference between means was statistically significant at the p<.05 level.
The four OUS questions were averaged together to form a single usability scale. Comics were rated higher than the PowerPoint presentation (see Table 1, Overall Average) and this difference was statistically significant. Looking at the individual OUS questions, the advantage for comics was statistically significant for ease of use and understandability ratings, but not for attractiveness and usefulness ratings.
Table 1. T-Test Results (two-tailed) for the Effect of Information Format (Comic vs. PowerPoint) on OUS Ratings
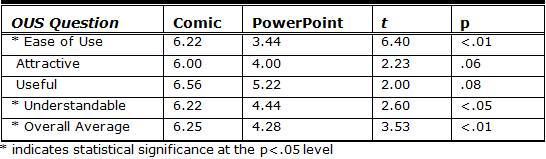
The SUS scores showed a large and statistically significant preference for Comics (Mean=88.1) over PowerPoint (Mean=43.6; t=8.63, p<.01).
So, both the OUS and SUS scales showed that users preferred Comics over PowerPoint.
Affective reactions
Participants in this study had strong reactions on an affective level to the two types of materials. During and after the sessions, participants discussed their perceptions of the comics in very different terms than they used for the PowerPoint presentations. The contrast was especially striking because we did not specifically probe on these issues unless the participant brought it up. Participants used terms like “friendly,” “easy,” “accessible,” “engaging,” and “fun.” In contrast, in discussing the PowerPoint, participants used more negative language, including that they felt the material was “dry,” “formal,” “overwhelming,” “threatening,” “frightening,” and “intimidating.” Our interpretation was that this affective response shows that the comics appealed to users at an emotional level. One participant said of the PowerPoint, “I don’t know if I would use the new feature because it was intimidating… Before I went into the app I was already stressed.” While in response to the comic, one user expressed the advantage of the comics particularly well, “A comic doesn’t make you afraid of it… how hard can it be if there’s a little comic strip?”
Study 2: Conceptual Comics
As a follow up, we wanted to explore the use of comics to explain conceptual information. In Study 2, in addition to a comic, we expanded to include the use of a metaphor in presenting the information. Respondents were asked to view metaphor- and non-metaphor-based comics along with a Microsoft PowerPoint-based form of the same information. In the metaphor-based comic, the metaphor of a sandwich bar was used to illustrate the attributes of the DITA concept. The use of the metaphor drew on a familiar understanding of another concept or idea (Kabapinar, 2005) to assess the hypothesis that such visuals might communicate understanding that the written form cannot ( Andriessen, Kliphuis, McKenzie, & Van Winkelen, 2009). DITA, the comic described, was like a sandwich bar because you could take the same component pieces and create very different end products. McKenzie and Van Winkelen (2011), for example, detailed how visual metaphors facilitated comprehension of knowledge management systems concepts. Use of metaphors and analogies is a complex area, providing a way to integrate human cognitive processes, such as visual perception, logical reasoning, similarity judgment, learning and transfer, creative thinking, and so on (Schwering, Kühnberger, & Kokinov, 2009). Weimann has used the concept of Lego® blocks to explain DITA (2010). As in the previous study, we used the comic templates from DesignComics.org to quickly and easily create the designs for the comics. A few clip art pieces from Microsoft Office completed the designs.
In comparison, we presented the same comic without the metaphor as well as a PowerPoint presentation of the same material. The comic without a metaphor contained the same panels as the first comic, except the reference to the sandwich bar was removed. The PowerPoint contained the same information, including some of the same diagrams that were used in each comic, but no other visuals. These diagrams showed the relationship between DITA elements with boxes, lines, and arrows. In both of the comics, a narrative was used with one character describing DITA to another character. After viewing all types of training materials, participants indicated their preferences for each type on the same two usability scales used in the previous study.
Twenty-seven participants, all technical writers at Oracle Corporation, saw each information presentation in a counterbalanced order: comic with metaphor (Comic/Metaphor), comic without metaphor (Comic/No Metaphor), or PowerPoint. We recruited globally for technical writers who were not currently using DITA for the creation of their material. We had participants in this study from the Americas, Europe, and Asia Pacific regions. Fourteen participants were female, thirteen male. No other demographic data was collected. All of the participants were aware of DITA, and in some cases, had some preliminary training. However, the majority did not know any particular details about how DITA works, or how they might use it.
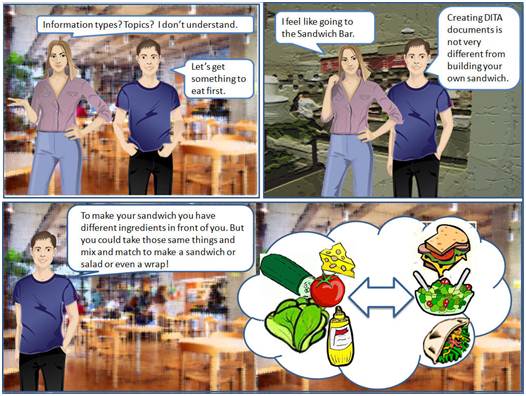
Figure 3. An example of the comic with the metaphor of a sandwich bar
Each group of nine participants viewed one of the three training materials first, after which they were presented a 12-question multiple choice test to assess their understanding of the information that they saw. All participants viewed all three training materials; however, they were quizzed only on the first material that they viewed. Following the presentation of each of the training materials, the participants were asked to assess their impressions of the materials using the OUS and the SUS.
Quiz Performance
One key question was whether the training materials showed differences in effectiveness. In the first study, there were clear preferences for the comic presentation, but no differences on the ability to perform the tasks in the prototype. In this study, we found some support for the differential effectiveness of the training material.
Table 2. Counts of Quiz Scores With Means and Standard Deviations
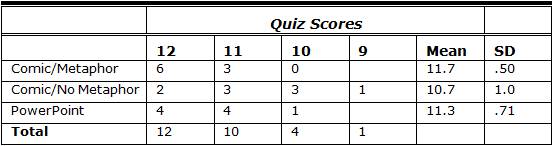
Participants could have scored from 0 to 12 on the quiz. Table 2 shows that most of the participants scored a 12 or 11 on the quiz, with some scoring 10, and one participant scoring 9. Due to the presence of a ceiling effect in this data, an ANOVA didn’t seem appropriate. One concern was that the standard deviations shrink as the means grow larger, and the largest standard deviation was twice the smallest.
One effect stands out when looking at Table 2. The Comic/No Metaphor condition produced the lowest scores. Four of five (80%) scores below 11 came from the Comic/No Metaphor condition. If we expect 1/3 (because there are 3 conditions) of the scores in the lowest categories to belong to the Comic/No Metaphor condition, then the observed value of 80% is statistically significant (p<.05) using the exact binomial test.
So, the differential effect of training materials on quiz performance can be seen for one condition (Comic/No Metaphor) among the lowest scores. It is interesting to note that Comic/No Metaphor was always second in the ratings data, below Comic/Metaphor and above PowerPoint.
Ratings
Means for the combined OUS ratings were Comic/Metaphor (Mean=6.02), Comic/No Metaphor (Mean=5.70), and PowerPoint (Mean=5.47). The main effect of training material on OUS ratings was not statistically significant at the p<.05 level (F=2.58, p=.10).
Concept-Based Comic Findings
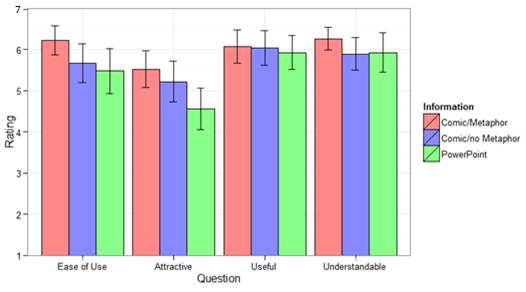
Figure 4. Average OUS ratings for the three training material conditions. Error bars show the 95% confidence interval, corrected for within subjects design using the R statistics package.
There were statistically significant effects of training material on SUS scores (F=3.75, p<.05). The Comic/Metaphor condition showed the highest average SUS score (Mean=79.4), followed by Comic/No Metaphor (Mean=74.4), and PowerPoint (Mean=68.0). The Comic/Metaphor condition produced higher ratings than PowerPoint (t=2.3, p<.05). The advantage of Comic/Metaphor over Comic/No Metaphor (t=1.8, p<.10) and Comic/No Metaphor over PowerPoint (t=1.4, p<.20) did not reach statistical significance at the p<.05 level.
The effect of presentation order on PowerPoint ratings
There appeared to be an effect of the order of presentation of instructional material on OUS and SUS ratings. Combined OUS ratings for the PowerPoint condition got lower as presentation order increased from first to third (Means=6.0, 5.5, 5.0). This order effect (F=2.33, p=.12) was not statistically significant at the p<05 level. A similar pattern was seen in the SUS ratings data (F=2.5, p=.10) as presentation order changed from first to third (Means=77.5, 70.3, 57.5). Though not statistically significant, the trends were nonetheless an interesting observation, suggesting that the preference for PowerPoint decreased as more alternatives were viewed.
Conclusions
Our data showed that comics had an affective appeal to participants. Participants found the comic to be a friendlier and more approachable form of communication. The first study showed that participants preferred a comic to a PowerPoint presentation with the same information. They felt that the comic was easier to use, more attractive, more useful, and more usable than a PowerPoint presenting the same information. Comics are easy to create with a variety of free, online tools that present storyboards and characters with talk bubbles. All the practitioner has to do is add the particulars of the information to be conveyed. In this study, we used a set of design characters that were explicitly created for use in usability activities (see www.designcomics.org) and are free to use. These particular cartoon figures and backgrounds make the creation of a comic simple and quick. Hardee (2011) described how powerful the use of a comic can be in telling a usability and design story.
The second study’s finding that the use of a comic alone was not as successful as the use of a comic that included a metaphor speaks to the power of metaphors as a communicative tool. It appeared there was a ceiling effect in the quiz data. Nonetheless, in future studies, we should use the metaphor in a PowerPoint presentation to determine whether metaphor alone could boost comprehension.
Also interesting was that the ratings for PowerPoint were negatively impacted by the presentation of an alternative comic format. When users saw the PowerPoint last, it was rated lower than when it was the first material presented to them, although this was not significantly different at the p<.05 level.
Comics appealed to users in an affective way. Participants responded at an emotional level in the first study to the comparison between the comic and the PowerPoint. Our conclusions are that comics are an effective method of conveying information to users and that combined with metaphors comics can be a useful training tool.
References
- Andriessen, D., Kliphuis, E., McKenzie, J., & Van Winkelen, C. (2009). Pictures of knowledge management. Developing a method for analysing knowledge metaphors in visuals. Electronic Journal of Knowledge Management 7(4), 405-414.
- Cheng, K. (2008, September 22). Comics in use everywhere! Rosenfeld, Retrieved from http://www.rosenfeldmedia.com/books/comics/blog/comics_in_use_everywhere/
- Davidson, S. (2008). Educational comics: A family tree. ImageTexT, Interdisciplinary Comics Studies 4(2). Retrieved from http://www.english.ufl.edu/imagetext/archives/v4_2/davidson/
- Duke Law Center for the Study of the Public Domain (2006). Tales from the public domain: Bound by law. Retrieved September 13, 2011 from http://www.law.duke.edu/cspd/comics/
- EduComics: Using Web Comics in Education. (2010). Retrieved from http://eacea.ec.europa.eu/llp/projects/public_parts/documents/comenius/com_mp_142424_educomics.pdf
- Gerde, V.W., & Foster, R.S. (2007). X-Men ethics: Using comic books to teach business ethics. Journal of Business Ethics, 77(3), 245–258.
- Hall, J. (2011). Books worth reading: Engaging material: Comics in the classroom. Change: The Magazine of Higher Learning, 43(2), 39-43.
- Hall, K., & Lucal, B. (1999). Tapping into parallel universes: Using superhero comic books in sociology courses. Teaching Sociology, 27(1), 60-66.
- Hardee, M. (2011). Serious UX design using comics. Cisco. Retrieved September 13, 2011, from http://blogs.cisco.com/webexperience/serious-ux-design-using-comics/
- Hughes, M. (2009, November 16). Visual methods of communicating structure, relationship, and flow. UX Matters. Retrieved from http://uxmatters.com/mt/archives/2009/11/visual-methods-of-communicating-structure-relationship-and-flow.php
- Jacobs, D. (2007). More than words: Comics as a means of teaching multiple literacies. English Journal, 96(3), 19-25.
- Kabapinar, F. (2005). Effectiveness of teaching via concept cartoons from the point of view of constructivist approach. Educational Sciences: Theory & Practice, 5(1), 135-146.
- Kamp, M., Slotty, P., Sarikaya-Seiwert, S., Steiger, H-J., & Hänggi, D., (2011). Traumatic brain injuries in illustrated literature: Experience from a series of over 700 head injuries in the Asterix comic books. Acta Neurochir 153(6), 1351–1355.
- Kneller, K. F. (2009). The use of comics-based cases in anchored instruction. Doctor of Education dissertation, submitted to the Department of Educational Technology, Research and Assessment, Northern Illinois University, De Kalb, Illinois.
- Mallia, G. (2007). Learning from the sequence: The use of comics in instruction. ImageTexT: Interdisciplinary Comics Studies, 3(3). Retrieved from http://www.english.ufl.edu/imagetext/archives/v3_3/mallia/
- McCloud, S. (1993). Understanding comics: The invisible art. New York: Harper Perennial.
- McCurry, J. (2008, June 5). US Navy’s comic answer to nuclear warship fears. The Guardian. Retrieved from http://www.guardian.co.uk/world/2008/jun/05/japan.usa
- McKenzie, J., & van Winkelen, C. (2011). Beyond words: Visual metaphors that can demonstrate comprehension of KM as a paradoxical activity system. Systems Research and Behavioral Science, 28(2), 138-149.
- Nitta, H., Takatsu, K., & Trend-Pro Co. Ltd. (2009). The Manga guide to physics. San Francisco, CA: No Starch Press.
- Ó Broin, U. (2011). Comics: Translation and other cultural points to consider. Retrieved September 13, 2011 from http://blogs.oracle.com/translation/entry/translating_comics
- Ó Broin, U., & Spradley, D. (2009). Writing patterns: Improving the help experience. Retrieved September 13, 2011 from http://blogs.oracle.com/usableapps/entry/writing_patterns_improving_the
- Odesk.com. How It Works. Retrieved September 22, 2011 from https://www.odesk.com/w/odesk_story
- Porter, J. (2010). Comics can make you a better communicator. The Content Wrangler. Retrieved September 13, 2011 from http://thecontentwrangler.com/2010/01/08/comics-can-make-you-a-better-communicator/
- Pratt, E. (2010). Documentation as an emotional experience. Retrieved September 13, 2011 from http://www.youtube.com/watch?v=5_04eW9iMeI
- Schwering, A., Kühnberger, K-U., & Kokinov, B. (2009). Analogies – Integrating cognitive abilities. Cognitive Systems Research 10(3), 175–177.
- Scott, L.M., & Vargas, P. (2007). Writing with pictures: Towards a unifying theory of consumer response to images. Journal of Consumer Research, 34 (3), 341-356.
- Sedaca, R. (2007, May 21). Comics: Not just for laughs! boxandarrows. Retrieved September 13, 2011 from http://www.boxesandarrows.com/view/comics-not-just-for
- Takahashi, M., Azuma, S., & Trend-Pro Co. Ltd. (2009). The Manga guide to databases. San Francisco, CA: No Starch Press.
- Takahashi, S., & Trend-Pro Co. Ltd. (2008). The Manga guide to statistics. San Francisco, CA: No Starch Press.
- Webb, E., Matsil, R., & Sauro, J. (2011). Benefit analysis of user assistance improvements. Ext. Abstracts CHI 2011, ACM Press, 841-850.
- Weimann, S. (2010). DITA reuse explained with LEGOs – The movie. Retrieved September 13, 2011 from http://dita.xml.org/resource/dita-reuse-explained-with-legos-the-movie
- Zehr, P. (2011). From Claude Bernard to the Batcave and beyond: Using Batman as a hook for physiology education. Advances in Physiology Education 35, 1-4.